
|
||||
| Fri, 08 Nov 2002 | |||
|
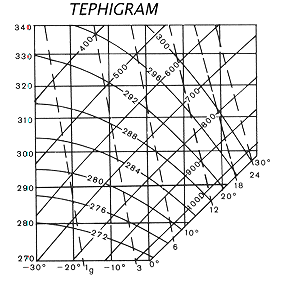
You are in: Weather > SA regional > Ecucation TEPHIGRAMS A "tephi" what ? If you are a pilot or a meteorologist, you are about the only people on this planet able to decipher this very useful chart. Click on the link below fo a typical tephigram issued by the SAWB : On the tephigram you will see myriads of criss-crossing lines - they will be explained, but all this diagram really is telling us what the conditions are like from the surface to the upper atmosphere. It is essentailly an energy diagram. It tells us which layers are moist and which are dry, and what the winds are doing at certain altitudes. Data collected by a weather balloon and radiosonde is plotted on a tephigram. Let's look at individual features of the tephigram :
The lines on the tephigram all represent a particular atmospheric variable, and so let's look at them all individually without the sounding data plotted on it.
This it the tephigram plot with all the lines on it, but without any data plotted on it. There are essentially 5 lines on the tephigram :
Firstly, an adiabatic process is one where no transfer of heat takes place. For instance, if if you took a parcel of air and made it rise into the atmosphere, it will cool as it expands (since pressure decreases with height), but no heat is gained or lost, sure the temperature drops, but that is a result of the air molecules being further apart, and not owing to heat loss. Heat is only lost during diabatic processes such as evaporation and condensation. Bergwinds are the best examples of adiabatic processes ! It is the reverse of the process of a parcel of air rising, expanding and cooling - a parcel of air brought to the surface from higher in the atmosphere, will compress and the temperature will increase at 10°C per 1000m as it descends. So how does this help me on the tephigram. Well, the process just described with bergwinds, is usefull - air at a high altitude if brought to 1000m will have a certain temperature, called the potential temperature which is an indication as to the amount of energy in the atmosphere. How would you calculate potential temperature - well, we will explain at the end...
These lines represent the temperature of the atmosphere.
These lines represent the pressure of the atmosphere.
We have already described what an adiabatic process is, and the explanations above assumed a DRY atmosphere. A wet adiabatic process is a pseudo-adiabatic process in reality, since there is a slight heat transfer, but we will explain this now. What if a parcel of air that rises and cools at 10°C per 1000m has moisture in it (like in the real world). You should know that as air cools, its capacity to hold moisture decreases and at a certain temperature (called the dewpoint temperature) the water vapour will undergo a phase change, i.e. it will condense into the liquid form and form cloud or fog droplets. If this parcel of air continues to rise, it cools less quickly, since condensation has released heat into the environent, i.e. air around the parcel, so it only cools at about 6.5«C per 1000m until all the moisture is condensed out of the parcel. When that happens, it will be dry and continue cooling at the dry adiabatic rate, called a lapse rate of 10°C per 1000m if it is still rising. However, let's say that we want to know how much energy there is in the atmosphere (which is always moist) and let's assume that we choose a parcel of air in a cloud and bring it to 1000m. Well, it will warm at 6.5°C per 1000m, and not at 10°C per 1000m since as it warms the water will evaporate, a process that needs heat to occur, so 3.5°C per 1000m goes into evaporating the water back into vapour. When that parcel finally reaches 1000m the temperature it now has is known as the equivalent potential temperature and is a better measure of the energy in the real atmosphere, than the potential temperature descirbed before.
Finally, the last of the lines - the mixing ratio lines. Mixing ratio merely refers to the amount of water vapour (grams) in the atmosphere per kilogram of air and is a great measure of the direct amount of water vapour in the atmosphere. So, we release a weather balloon with a radiosonde that collects the following data every 10 seconds or less as it rises :
So at almost every point in the atmosphere, we know the temperature, pressure, water vapor content and what the winds are doing. We plot the temperature measured by the radiosonde against the pressure it was measured at, and soon we will have the temperature line you saw on the first figure. We also then plot the dewpoint line which is calculated from the humidity measurements. Finally the wind data is plotted at certain significant levels (i.e. 850 hPa, 700 hPa, 500 hPa, 400 hPa, 300 hPa, 200 hPa and 100 hPa) or at predetermined flight levels and these winds are plotted in the same manor that station model winds are plotted. Many, many different atmospheric variables essential to forecasting can be calculated from the tephigram. These inlude stability indices, thunderstorm likelihoods, inversions, how quickly thunderstorms are likely to develop in the day, how strong the SE wind will blow in Cape Town and many other vairables. The tephigram in the first figure, shows a moist layer and a dry layer - where the two dark lines are closer together, the more moist the atmosphere, the further apart, the drier the atmosphere. Needless to say, to try and explain exactly how these variables are calculated, would only be of interest to pilots and meteorologists, and are difficult to explain in the context of this article. [ back ]
|
 | ||
 | ||
|
|
||
 | ||
|
ALEXANDER BAY 20/11 BETHLEHEM 23/08 BEAUFORT WEST 32/16 BLOEMFONTEIN 27/11 CALVINIA 28/15 CAPE TOWN 21/15 DE AAR 20/12 DURBAN 28/15 EAST LONDON 27/15 ERMELO 22/12 GEORGE 32/09 GRAHAMSTOWN 30/12 JOHANNESBURG 22/10 KIMBERLEY 30/14 KLERKSDORP 28/13 LADYSMITH 26/12 MAFIKENG 29/15 NEWCASTLE 25/11 NELSPRUIT 26/16 OUDTSHOORN 34/13 POLOKWANE 23/13 PORT ELIZABETH 26/13 PHALABORWA 25/15 PORT ST JOHNS 28/16 PIETERMARITZBURG 29/12 PRETORIA 25/13 POTCHEFSTROOM 27/10 QUEENSTOWN 31/15 RICHARDS BAY 28/16 SPRINGBOK 24/19 SOWETO 24/10 SKUKUZA 27/17 TZANEEN 22/14 UPINGTON 28/15 UMTATA 32/15 ULUNDI 28/16 VRYBURG 29/15 VREDENDAL 25/09 VEREENIGING 25/13 WITBANK 25/13 WELKOM 29/13 WORCESTER 31/12 |
||
|
| DISCLAIMER | FEEDBACK | ABOUT US | ADVERTISING | CONTACTS | SERVICES & PRODUCTS |
Your use of this site constitutes your acceptance of the LEGAL RESTRICTIONS AND TERMS OF USE
|


)